ARC-AGI: The Efficiency Story the Leaderboards Don't Show

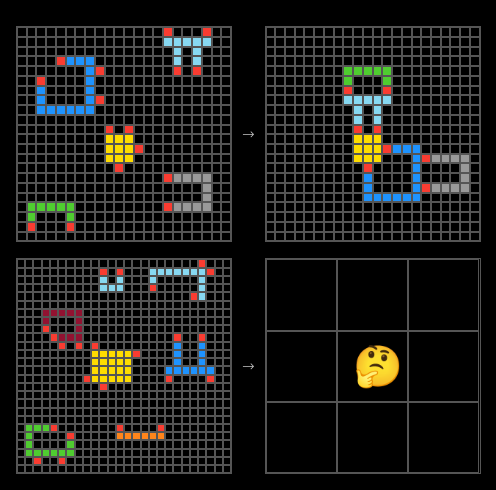
ARC-AGI is a benchmark designed to test genuine reasoning ability. Each task shows a few input-output examples, and you have to figure out the pattern and apply it to a new input. No memorization, no pattern matching against training data. Just pure abstraction and reasoning on challenging visual problems.
It's become one of the key benchmarks for measuring AI progress toward general intelligence, with a $1M prize for the first system to score 85% on the private evaluation set.
Open the ARC Prize leaderboard and you'll see scores climbing up and to the right. That looks like progress! But then you notice the x-axis isn't time—it's cost. Higher scores cost more per task.
That made me wonder: What does it mean if it's a roughly 45-degree line? Doesn't that just mean that we're buying intelligence by scaling up compute?
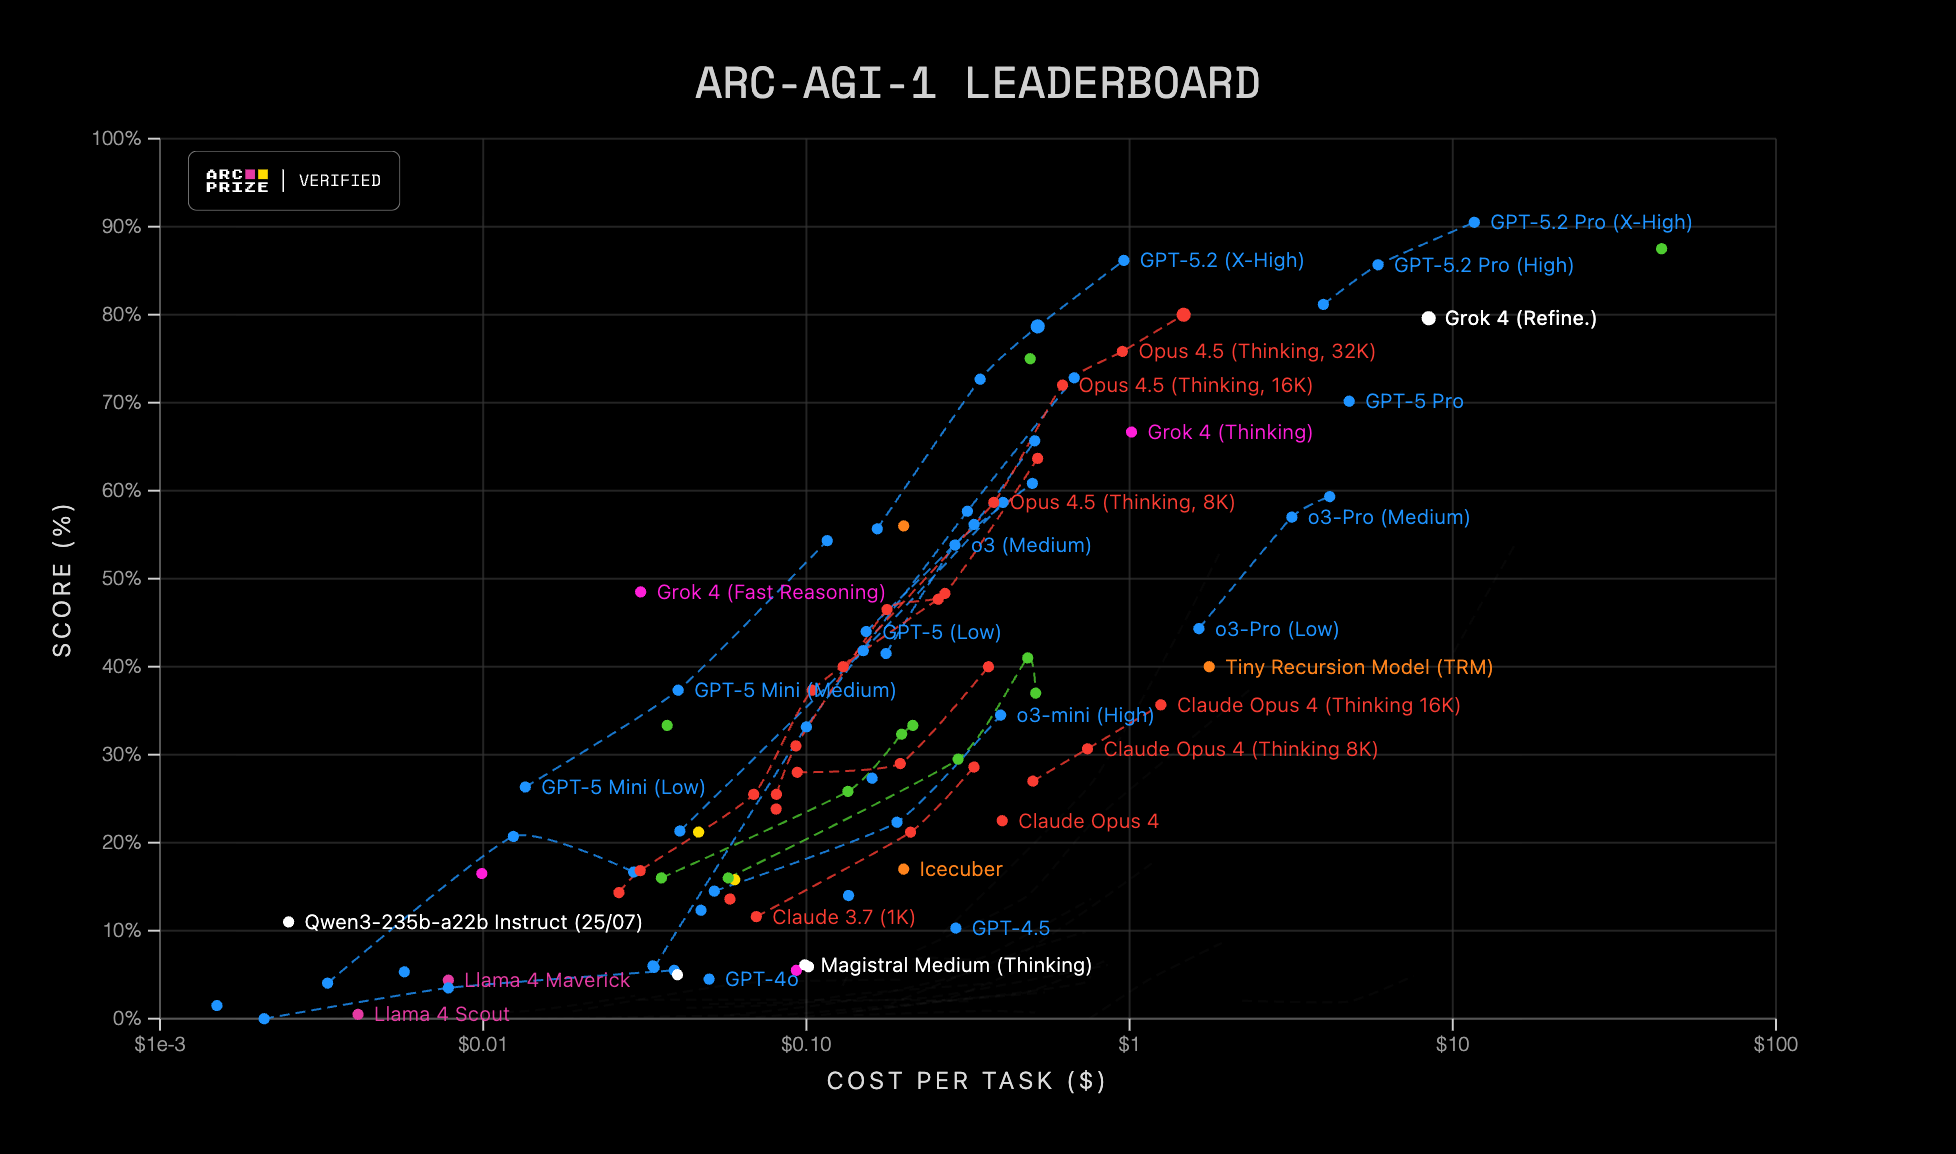
So I dug in... and I found a very different story.
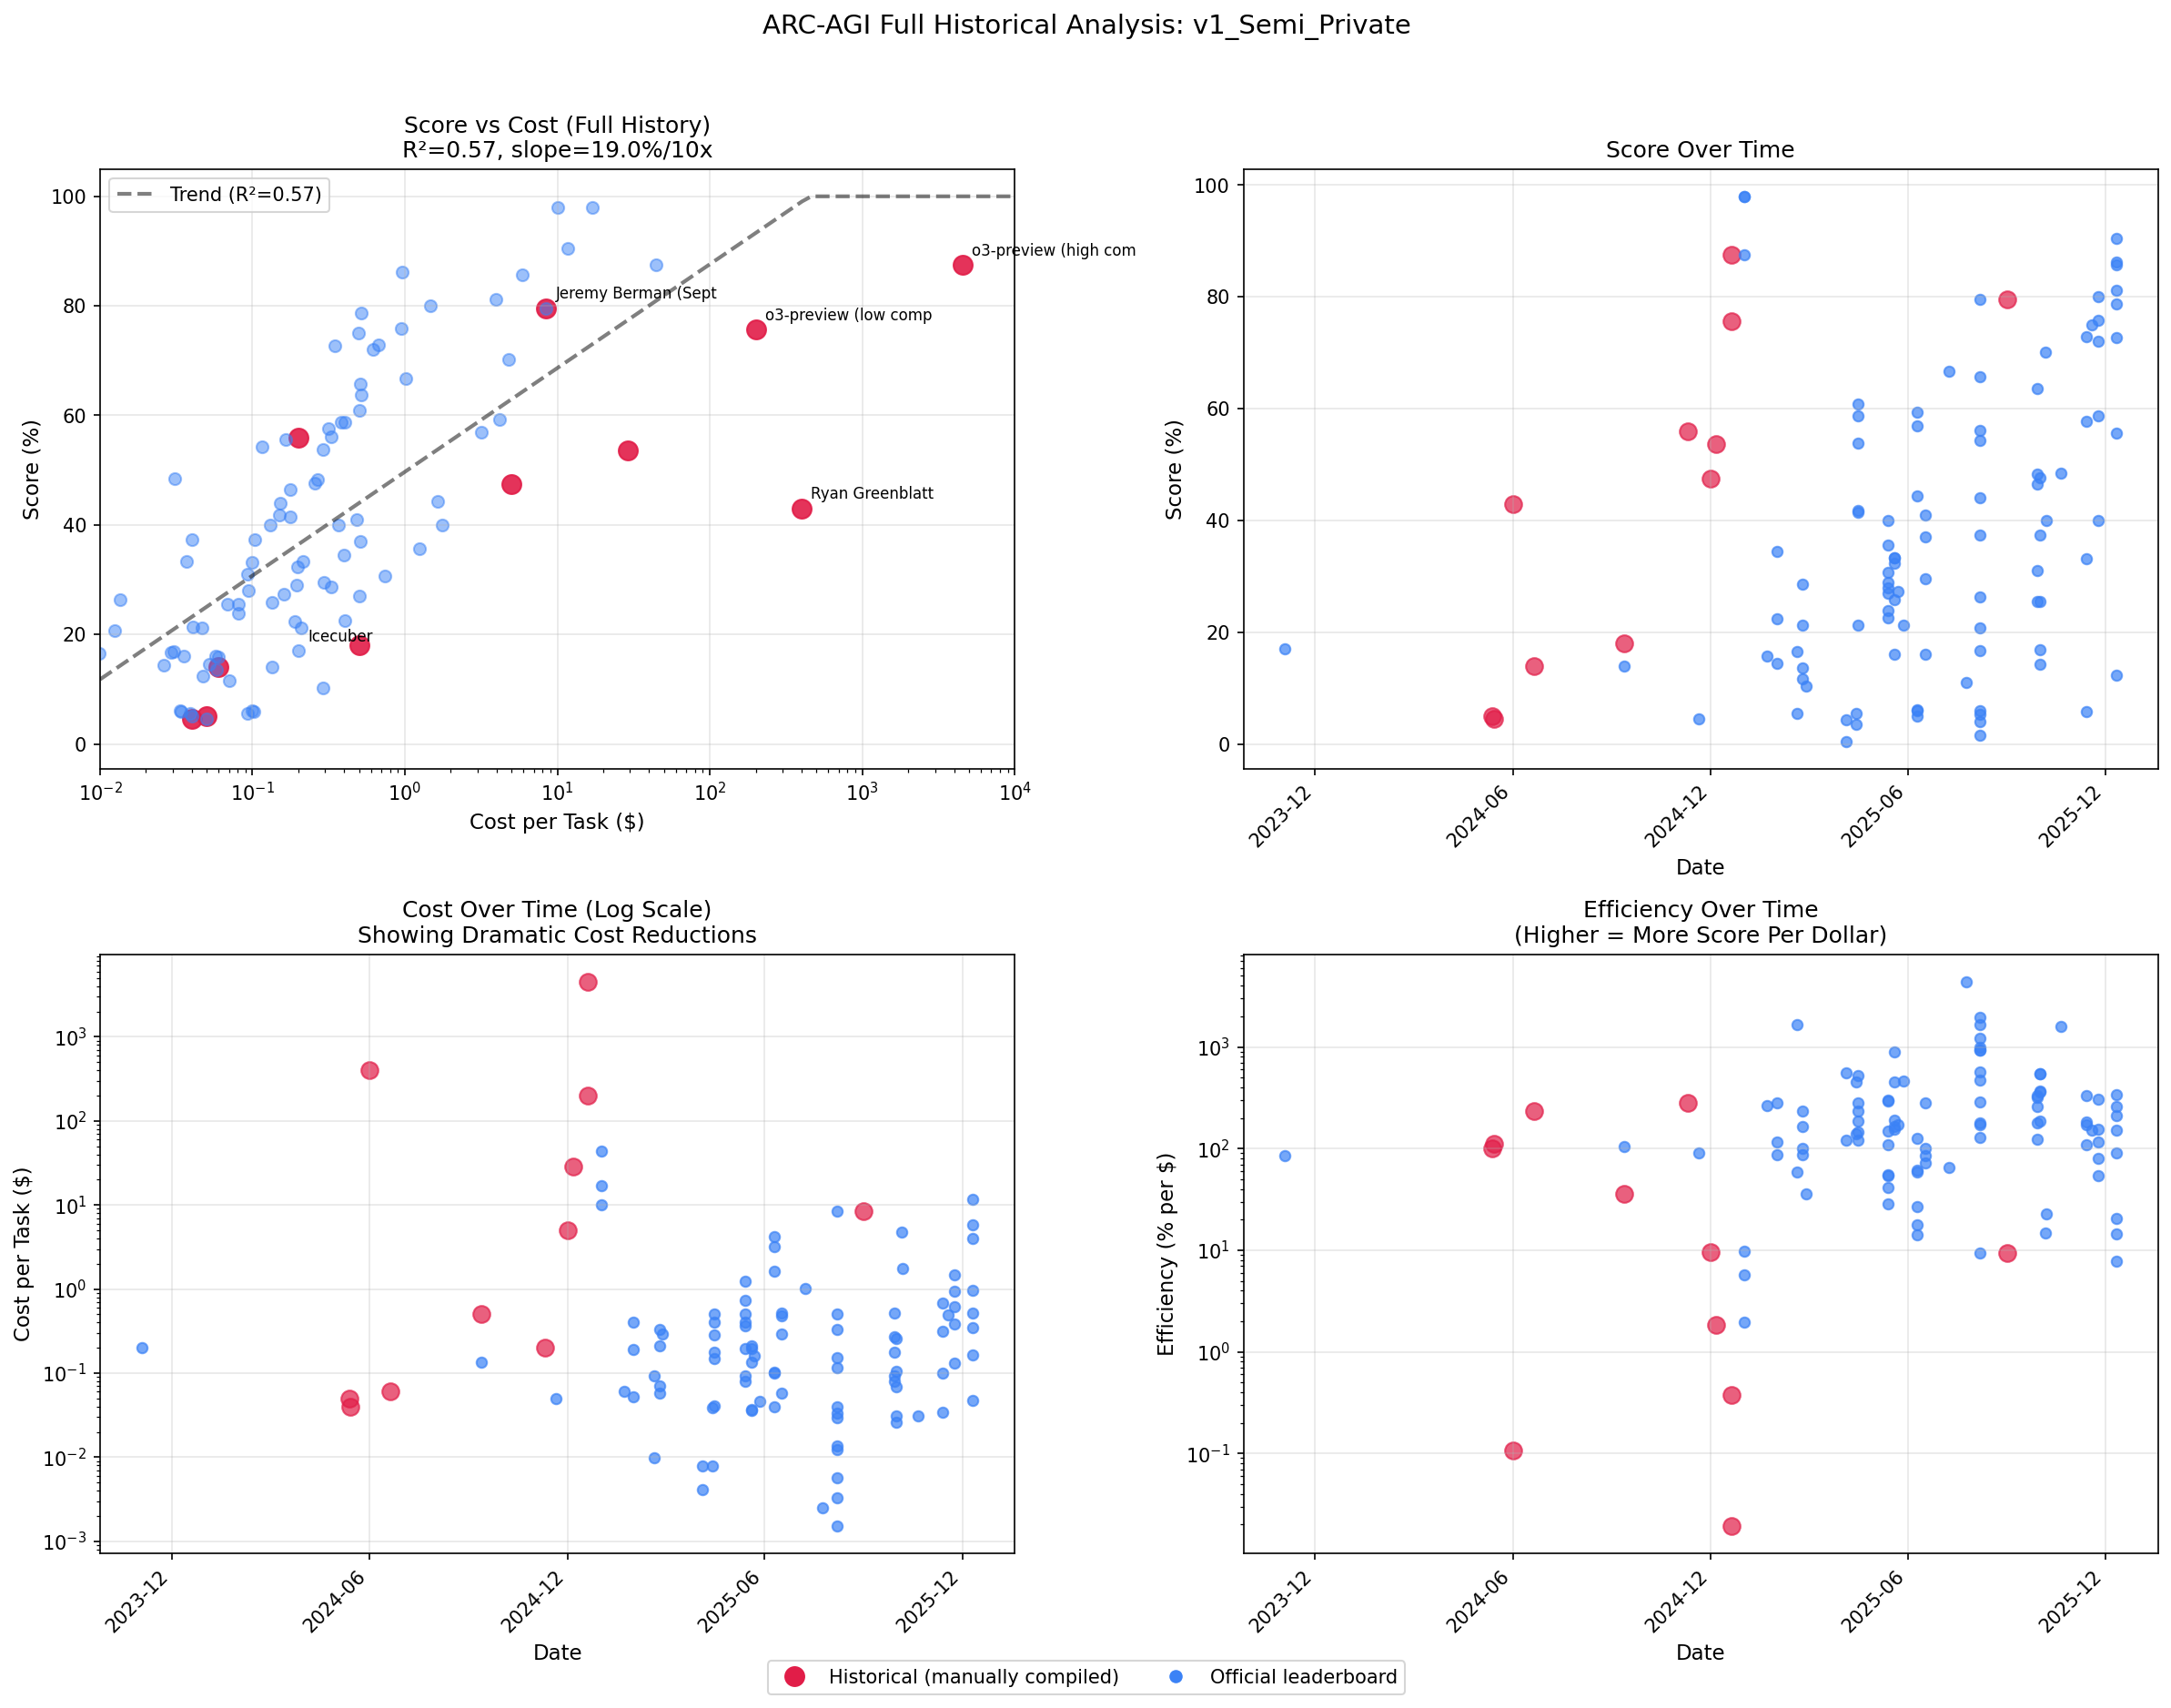
The leaderboard is a snapshot in time. Each dot shows the price and setup from when the result was achieved, but not what that same method might cost today. Models get cheaper, and even older models can improve with better techniques and scaffolding.
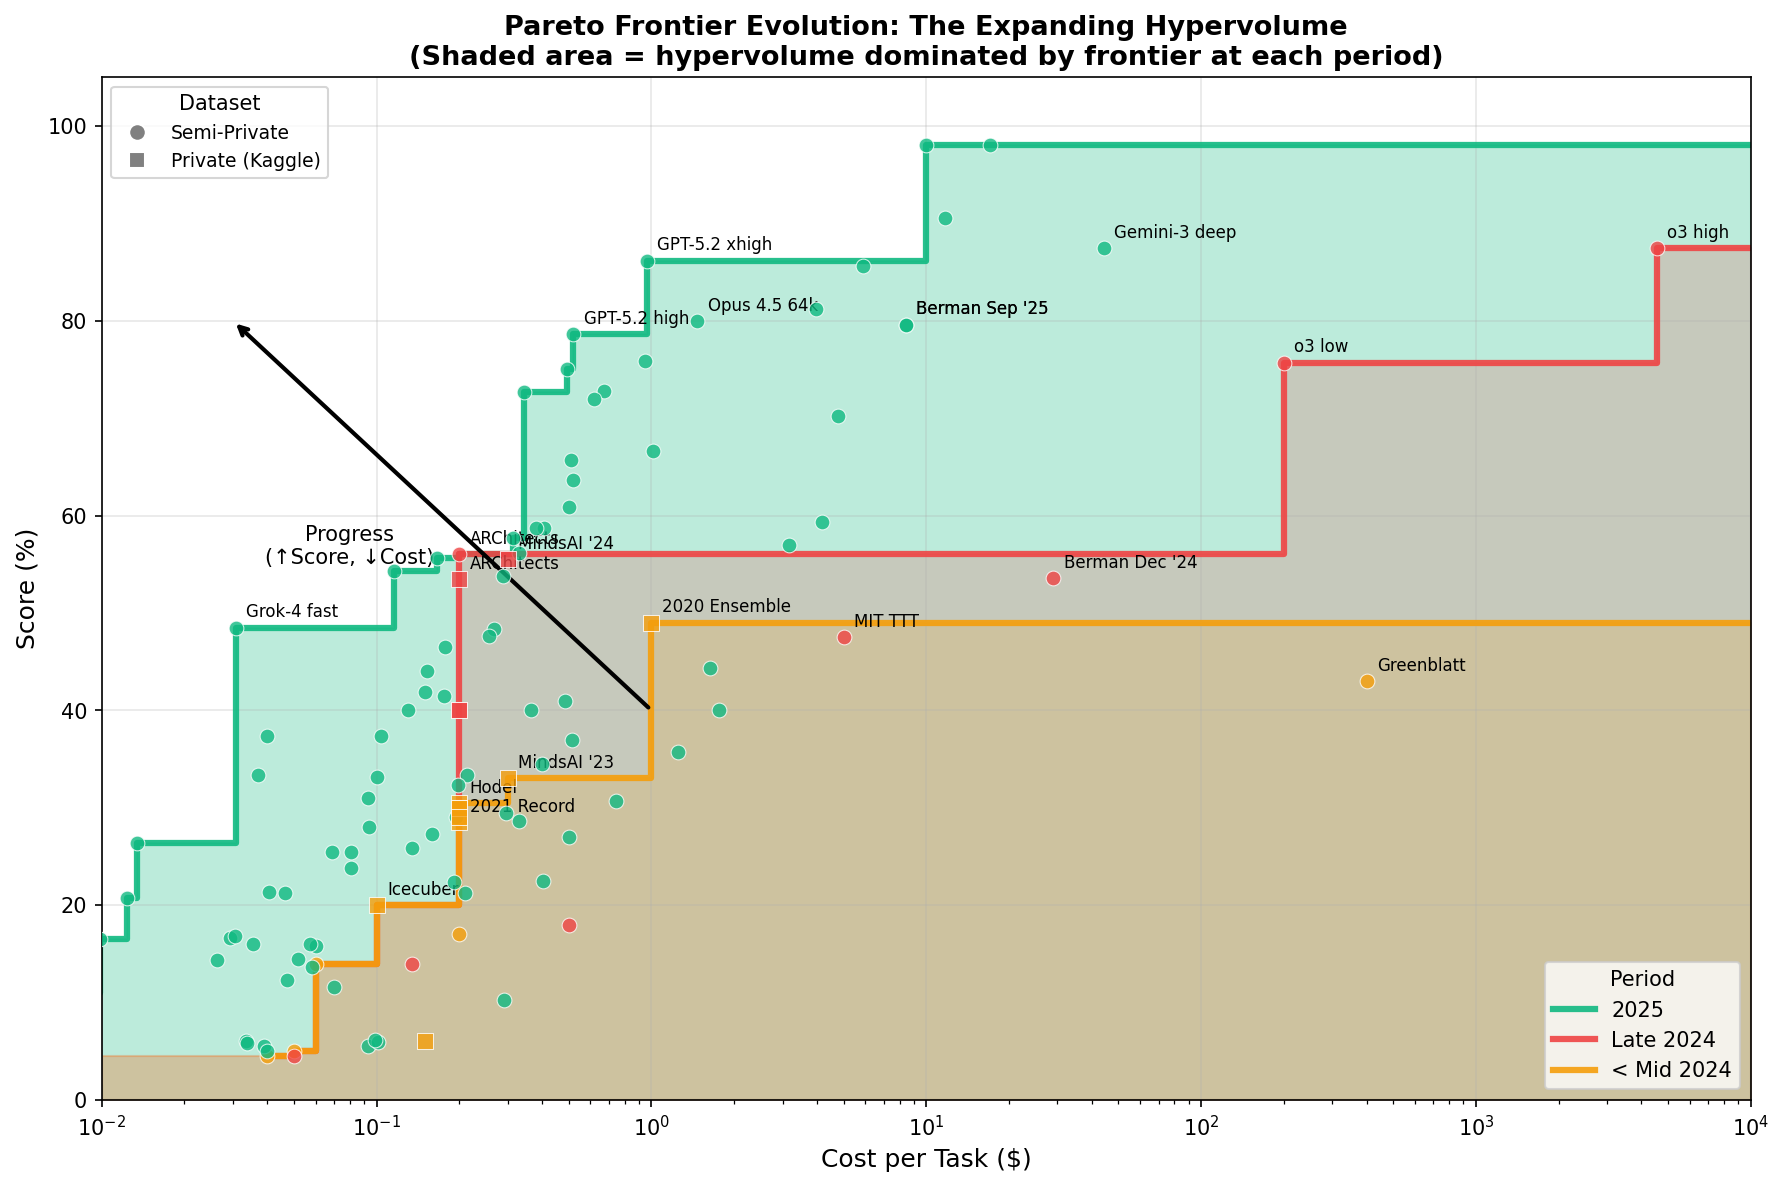
If you turn the snapshot into a time series, then the story changes: the efficiency frontier has been sprinting left.
The Two Numbers That Matter
On the v1_Semi_Private evaluation set (ARC-AGI-1):
| Score Bracket | Then | Now | Reduction | Timeframe |
|---|---|---|---|---|
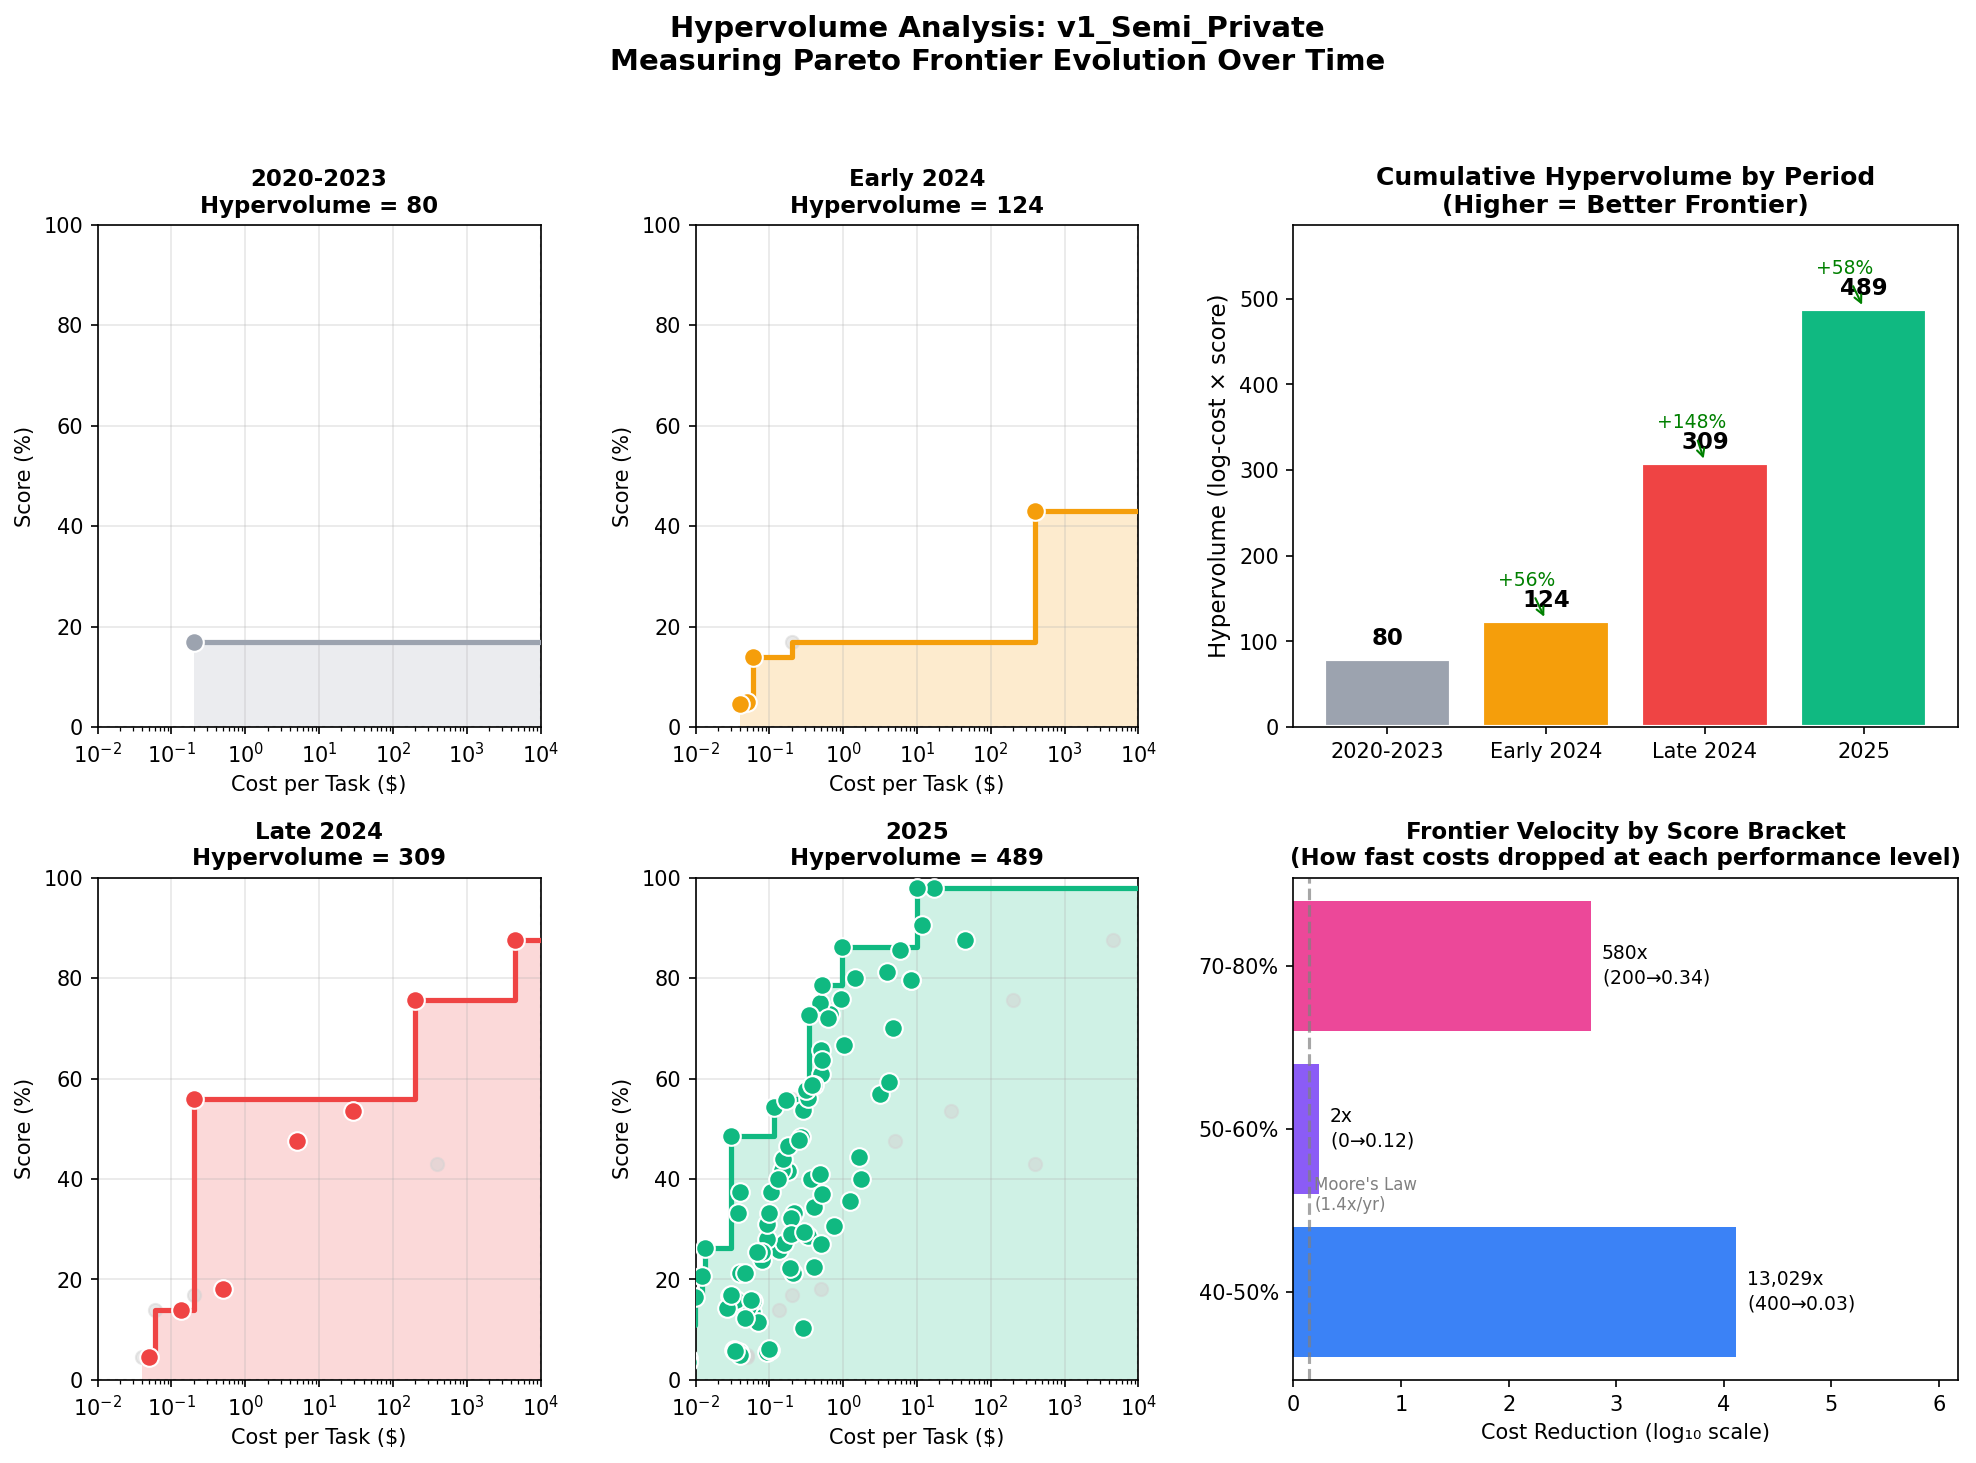
| 70-80% | ~$200/task (o3, Dec '24) | $0.34/task (GPT-5-2, Dec '25) | ~580x | ~12 months |
| 40-50% | ~$400/task (Greenblatt, Jun '24) | $0.03/task (Grok-4, Oct '25) | ~13,000x | ~17 months |
That is not "hardware got 1.4x better." That is the frontier shifting.
What to Take Away
- The leaderboard is a photograph, not a movie. The diagonal trend mostly reflects what frontier runs looked like at the time, not what's achievable now.
- Expensive historical runs may not appear due to the $10k total cost cap and evolving verification rules.
- The real action is the frontier shifting left. Expensive breakthroughs get rapidly compressed into cheap, repeatable systems.
Why the Leaderboard Creates a Diagonal Illusion
Here's the mechanism:
- Frontier results are expensive at birth. New ideas get tried with frontier models, lots of sampling, and messy scaffolds.
- Then the idea gets industrialized. People distill, cache, prune, fine-tune, batch, and port to cheaper models.
- The leaderboard preserves the birth certificate. It shows the original cost, not the "mature" cost a year later.
So the diagonal isn't proof that performance is permanently expensive. It's proof that the first version of a breakthrough is usually inefficient.
Pareto Frontier Over Time
To measure progress properly, we should track the pareto frontier, not the cloud.
I use the hypervolume of the Pareto frontier (maximize score, minimize cost), computed in log₁₀(cost) so a 10x cost drop matters equally anywhere on the curve.
| Period | Cumulative Points | Hypervolume | Change |
|---|---|---|---|
| 2020-2023 | 1 | 80 | — |
| Early 2024 | 5 | 124 | +55% |
| Late 2024 | 13 | 309 | +149% |
| 2025 | 109 | 489 | +58% |
The hypervolume grew ~6x from 2020-2023 to 2025. That's not "a few points got better." That's the entire feasible cost-performance menu expanding.
What's Driving the Leftward Shift?
Three forces keep repeating:
1. Train the Instinct (Test-Time Training)
Instead of spending inference compute "thinking harder," pre-train the model's instincts on ARC-like distributions. The MIT/Cornell TTT approach trains on 400,000 synthetic tasks, achieving 6x improvement over base fine-tuned models. Inference gets cheaper; training cost gets amortized.
2. Search Smarter (Evolutionary Test-Time Compute)
Berman-style pipelines evolve candidates across generations, using models to generate and judge. Earlier versions evolved Python programs; later versions evolved natural-language "programs"—same architecture, different representation. This achieves 79.6% at $8.42/task.
3. Cheaper Base Models + Distillation
Even if the algorithm stayed the same, underlying model price-performance improves. But the frontier shifts here—580x to 13,000x—are too large for pricing alone to explain.
The Pattern the Leaderboard Hides
The real story is a two-step cycle:
- Someone pays a painful cost to prove a new capability is possible.
- Greenblatt: ~$400/task to hit 43% (Jun '24)
- o3: $200-4,560/task to hit 75-87% (Dec '24)
- Everyone else spends the next months making that capability cheap.
- ARChitects: 56% at $0.20/task (Nov '24)
- Grok-4 fast: 48.5% at $0.03/task (Oct '25)
- GPT-5-2: 78.7% at $0.52/task (Dec '25)
Expensive proof-of-concept → ruthless optimization → cheap, repeatable performance
The leaderboard snapshot mostly shows step 1. This analysis shows step 2.
Implications
For the ARC Prize: The leaderboard could better serve the community by showing cost trends over time, clearly labeling benchmark splits, and making the Pareto frontier visible.
For Measuring AI Progress: Cost-efficiency improvements of 580-13,000x in about a year suggest genuine progress—though disentangling algorithmic innovation from cheaper base models requires more careful analysis.
For Practitioners: Today's expensive frontier approach will likely be much cheaper within a year. The Pareto frontier is moving faster than hardware roadmaps suggest.
Small Print
- All cost-frontier analysis uses v1_Semi_Private (100 tasks).
- Cost = run cost (API tokens or GPU inference). Training costs excluded.
- Historical estimates labeled "(est.)"; official
evaluations.jsondata used where available.
For the full benchmark taxonomy, detailed cost methodology, and historical tables, see the appendix below.
Appendix: Detailed Data
Benchmark Taxonomy
- v1_Private_Eval (100 tasks): Official Kaggle competition scoring. Kept confidential.
- v1_Semi_Private (100 tasks): Verification set for ARC-AGI-Pub submissions. This analysis's primary focus.
- v1_Public_Eval (400 tasks): Public evaluation set. Scores tend higher, possibly due to training contamination.
v1_Semi_Private Historical Results
| Date | Method | Score | Cost/Task | Notes |
|---|---|---|---|---|
| Jun 2024 | Ryan Greenblatt | 43% | ~$400 (est.) | ~2048 programs/task, GPT-4o |
| Sep 2024 | o1-preview | 18% | ~$0.50 | Direct prompting, pass@1 |
| Nov 2024 | ARChitects | 56% | $0.20 | TTT approach |
| Dec 2024 | Jeremy Berman | 53.6% | ~$29 (est.) | Evolutionary test-time compute |
| Dec 2024 | MIT TTT | 47.5% | ~$5 (est.) | 8B fine-tuned model |
| Dec 2024 | o3-preview (low) | 75.7% | $200 | 6 samples |
| Dec 2024 | o3-preview (high) | 87.5% | $4,560 | 1024 samples |
| Sep 2025 | Jeremy Berman | 79.6% | $8.42 | Natural-language programs |
| Dec 2025 | GPT-5-2 thinking | 78.7% | $0.52 | Current frontier efficiency |
| Dec 2025 | Grok-4 fast | 48.5% | $0.03 | Remarkable low-cost |
Plus 90+ additional 2025 entries from the official leaderboard.
v1_Private_Eval (Kaggle) Historical Context
| Date | Method | Score | Cost/Task |
|---|---|---|---|
| Jun 2020 | Icecuber | 20% | ~$0.10 (est.) |
| Jun 2020 | 2020 Ensemble | 49% | ~$1.00 (est.) |
| Dec 2021 | Record broken | 28.5% | ~$0.20 (est.) |
| Feb 2023 | Michael Hodel | 30.5% | ~$0.20 (est.) |
| Dec 2023 | MindsAI | 33% | ~$0.30 (est.) |
| Nov 2024 | ARChitects | 53.5% | $0.20 |
| Nov 2024 | MindsAI 2024 | 55.5% | ~$0.30 (est.) |
Progress was remarkably slow from 2020-2023: just 13 percentage points in 3.5 years. Then 2024 changed everything.
Cost Estimation Notes
Greenblatt (~$400/task): ~2048 programs generated per task with GPT-4o at June 2024 pricing. Order-of-magnitude estimate.
MIT TTT (~$5/task): 8B parameter fine-tuned model, ~$1/GPU-hour cloud infrastructure. Training costs excluded.
Berman Dec '24 (~$29/task): 500 function generations per task with Claude 3.5 Sonnet. Estimate based on token counts in his writeup.
o3 costs: The original announcement showed ~$26/task for the 75.7% run; current evaluations.json shows $200/task. I use leaderboard data for consistency.
Data Sources
- ARC Prize 2024 Technical Report
- Official Leaderboard Data
- Jeremy Berman's Substack
- Product-of-Experts Paper
- Epoch AI: LLM Inference Price Trends
Analysis Code
historical_arc_results.py— compiled data with sourcescompute_hypervolume.py— hypervolume calculationplot_full_history.py— visualization code
The efficiency frontier might be moving faster than the leaderboard shows. The next few years should be very interesting.